
Executive summary
Vote tripling is a suite of tactics that encourages people to remind three friends to vote. While campaigns and GOTV organizations can control whom they recruit to be vote triplers, the tactics cannot easily control which friends the triplers reach out to. Using a sample of New York State voters, we conducted a novel experiment to identify and analyze the friends that triplers select, as well as understand how messaging can influence triplers’ friend selections. Our findings confirm that the friends mobilized by triplers are generally voters that campaigns would indeed like to reach themselves, and therefore vote tripling is a viable tactic for campaigns. This paper presents findings about the various characteristics of vote triplers and their friends, as well as guidelines for campaigns regarding types of triplers to target and how messaging can influence tripler behavior.
Partisanship
Study findings
We find that Democratic triplers select reliably Democratic friends. Overall, around 75-80% of votes generated by triplers would be expected to be Democratic votes; this number rises to 80-83% among those most likely to triple in practice. Put differently, triplers select friends about 15 percentage points more Democratic than the overall population.
However, triplers on average select a slightly less Democratic-leaning population than the average Democratic campaign. It appears that this is due to errors in triplers’ perception of their friends’ partisanship, rather than lack of intention to target Democrats.
Coaching triplers to specifically select “Democratic friends” is very effective in boosting the partisan targeting of friends, boosting the portion of Democratic votes generated by as much as 10 percentage points, and nearly boosting the partisan accuracy of triplers’ targeting to that of an average campaign.
Some triplers are better than others at selecting left-leaning friends. Triplers reliably pick more Democratic friends if they themselves are reliably Democratic, if they are politically active, and if they are part of a racial minority. Triplers with higher voter propensity do not, on average, pick more reliably Democratic friends.
Campaign takeaways
Generally, campaigns can be confident that, when they recruit Democratic triplers, the triplers will select reliably Democratic friends. Any voters with partisanship scores over 60 are very likely to produce net Democratic votes.
Campaigns may consider explicitly asking triplers to remind three of their “Democratic friends” to vote.
If campaigns have limited resources or do not want to risk generating GOP votes, they should aim to recruit triplers with especially high partisanship scores, triplers who are politically active, and triplers who are people of color.
Voter Propensity
Study findings
We find that triplers select friends of about average voter propensity. Friends have slightly lower voter propensity than the triplers who select them.
While on average triplers select friends with vote propensity similar to their own, the correlation is far from perfect. High-propensity triplers select plenty of low-propensity friends, and vice versa. In recent high-profile elections, 35-40% of friends have voting records that do not match triplers; i.e., the tripler voted and the friend did not, or vice versa.
Triplers generally have inaccurate perceptions of their friends’ propensity to vote and so cannot be coached to target lower propensity voters.
Campaign takeaways
While low-propensity triplers are more likely to mobilize low-propensity friends, triplers of any voter propensity are valuable; it is not the case that high-propensity triplers only mobilize voters who would otherwise have already voted.
It does not appear possible to influence triplers to remind lower — or higher — propensity voters.
Location
Study findings
We find that triplers overwhelmingly (~80%) select registered voters in the same state, rather than unregistered or out of state voters. However, this finding is subject to considerable uncertainty given the nature of the study.
We find that triplers do not necessarily select especially geographically proximate friends. In non-urban areas, a majority of friends selected are within the same congressional district, but only about half are within the same legislative district. In urban areas, these numbers are even lower.
Triplers do not seem to respond meaningfully to coaching that would yield more nearby friends. Triplers appear especially resistant to coaching for selecting family or co-residents.
Campaign takeaways
For campaigns seeking to do state level organizing, triplers will be effective in recruiting friends within the same state to vote.
For campaigns seeking to do hyper-local organizing, these findings have ambiguous implications.
It appears difficult to influence triplers to choose friends that live closer to them, although it is possible that better messaging would be successful.
Demographics
Study findings
Triplers select friends that resemble them demographically, in terms of gender (66% same gender), race (80% same race), and age (53% within five years of age).
Campaign takeaways
Campaigns can recruit triplers with relative certainty about what types of friends will be selected along the axes of age, gender, and race.
1. Background/method
Because VoteTripling.org does not typically collect detailed data on triplers’ friends1, we generally know very little about whom triplers select and whether these selections can be coached by campaigns. To address this issue, we recruited a panel of online subjects in New York2, asked them hypothetically to vote triple, and had them tag the friends they would select using the organizing platform Reach, which was loaded with the entire New York State voter file.3, 4 Note that subjects were asked to list the first names of the three friends they would remind before they knew about the tagging in Reach, so the initial selection process was not influenced by the Reach component, which is not part of canonical vote tripling.5
After subjects tagged their friends, we also asked them to tag themselves in Reach. Finally, we asked subjects their impressions of their and their friends’ partisanship and voter propensity, and collected self-reported demographic information.
As much as possible, we attempted to mimic real-life vote tripling in the study. We told subjects: Suppose a political campaign you support sent you the following message:
“Hi there! This is Jon from the Jane Doe for Congress campaign. Election day in New York is coming up in two weeks. Can we count on you to remind 3 friends to vote?”6
Imagine that you agreed to do so. Enter below the FIRST NAMES of the three friends you would remind to vote.”7
To assess whether the selection of friends can be “coached,” subjects were shown one of five slightly different vote tripling messages (differences highlighted in red):
Message 1 (Control): “Hi there! This is Jon from the Jane Doe for Congress campaign. Election day in New York is coming up in two weeks. Can we count on you to remind 3 friends to vote?”
Message 2 (Dem): remind 3 Democratic friends to vote
Message 3 (Nudge): remind 3 friends to vote who you think could use a nudge to get to the polls
Message 4 (Neighbors): remind 3 neighbors or housemates to vote
Message 5 (Family): remind 3 family members to vote
Note that there was a slight error in the survey coding that could have blunted the impact of messages 4 and 5. While the messaging itself called for selecting neighbors, housemates, or family members, the rest of the page returned to “friends”: first, with “Enter below the FIRST NAMES of the three friends you would remind [emphasis added]” and second next to the fields where subjects entered names, which were labeled “Friend #1,” Friend #2,” and “Friend #3.” This could have served to mitigate against the family/neighbor/housemate signal from the message.
Subjects were adults in New York State who reported in response to a congressional generic ballot that they would definitely or probably vote for the Democrat, or that they were not sure.
After the study was complete, we purchased full Targetsmart data on all voters tagged in Reach, including voter file based demographics, partisanship scores, and voter propensity scores.
1: Someone who reminds three people to vote is a “tripler.” The people they remind are generally referred to as their “friends,” even in cases where those friends are actually family, neighbors, etc.
2: The majority of the panel was recruited with Lucid. The survey was briefly on Amazon Mechanical Turk and on Qualtrics panels, which together ultimately accounted for only 11% of completes.
3: Reach’s pricing is based on the number of voters loaded into the system, so using more than a single (large) state was cost prohibitive. We selected New York because of ease of data availability. The voter file loaded in reach contained inactive voters, but not purged voters.
4: We confirmed that participants were using Reach correctly by asking them to look up a celebrity in Reach and report back to us data from the app.
5: In a screener, participants were warned they would have to provide some information using a website, but it was not made clear what that would be.
6: Note the choice of a House campaign was intentional; we look to see if people selected voters in their House district.
7: The method via which subjects were shown these messages changed slightly during implementation. For roughly the first 10% of subjects, subjects saw the message on a page by itself, to induce subjects to focus on the message, and clicked to the next page before being asked to provide names. We later decided this design probably decreased the salience of the message when subjects were selecting names, and was not comparable to vote tripling ‘in the wild,’ where the message remains in front of the tripler while the select friends. For the remaining 90%, they saw the tripling pitch on the same page that they selected names.
2. Sample
2.1 Recruitment and sample size
Getting a significant sample size for this study was a challenge, as the study requested more personal information than many other similarly-executed studies, required subjects to be on a computer rather than a mobile phone, and, for a period, required subjects to sign up for a Reach account. Over the course of about two months, 6,339 people began the study, 802 made it8 through the basic screener, and 243 actually used Reach to tag themselves and/or their9 friends. Three were discarded for quality reasons, leaving 240.
There is an open question about to what degree these 240 subjects were giving us real data in Reach10, versus tagging arbitrary voters with the same first name as their friends. There was no incentive not to do this, and plenty of incentive to do so if subjects were wary of their personal privacy. The fact that we asked Reach users to tag themselves provides a quality check: we asked subjects their birth year in the survey screener, and we can compare this self-reported age to subjects’ age in the voter file if they tagged themselves. Because Reach does not display voters’ ages — nor does it make it easy to filter on age — it is unlikely subjects would have found a decoy voter of their own age to tag as themselves. Of the 240 subjects, 163 tagged11 themselves in Reach, and 110 of those have ages matching the self-report. (An additional 9 took the survey before we added the birth year question.) There is corroborating evidence that in these age-mismatch cases, subjects did indeed tag a decoy voter as themself: among age-mismatch subjects there is much lower geographic proximity to friends, and much lower age proximity to friends.
Restricting to only the 110 is probably too conservative for a few reasons:
some of the 77 subjects who did not find themselves in Reach probably still tagged friends correctly,
some subjects may have intentionally masked their own data but willingly tagged their friends,
some of the birth years reported in the survey may have been incorrect, rather than the tagged self, and
some of the 9 who took the survey before we required birth year were honest. Still, for robustness, we ran most results on the 110, dropping age-mismatches - especially for any results interacting friends' and triplers’ data (e.g., impact of triplers' partisanship on friends’ partisanship12). We refer to the larger sample as S1 and the sample of 110 as S2.
On the other hand, this robustness check is probably too weak because it offers no check on the reliability of friend matches. Subjects may have correctly tagged themselves but erroneously tagged their friends. In this sense, data on friends may be biased slightly towards a random sample.
All in all, the number of subjects and tagged friends is as follows13:
Table 1: Sample size
8: Subjects were rejected because they: (a) were on mobile phones, (b) were Republicans, (c) indicated they would not be willing to use Reach and provide personal information, or (d) failed an attention check, which was later removed
9: Many subjects dropped out when they had to click over to Reach.
10: We can confirm that the names of voters tagged in Reach matched the reported names of friends in all but a few cases, which we dropped.
11: Note we asked subjects their birth years twice during the study, and we allow them through if the age matches on either time, even if they entered it incorrectly once.
12: Another strategy would be to include subjects whose age did not match their tagged self in the voter file, but whose age is close to the ages of the friends they tagged. However, the distribution of the difference between tripler’s self-reported age and friends’ ages for those subjects whose self tags do not match ages shows only a very limited cluster around zero, barely distinguishable from background noise. This suggests that including such matches would introduce more noise than signal.
13: 34 more were tagged in Reach while somehow not being mentioned in the Qualtrics survey. It is not clear how this happened, and we dropped these observations
2.2 External validity
One issue in the generalizability of this study is that our subject population is not necessarily representative of triplers that would be recruited in a real campaign or GOTV operation. In practice, only small minorities of voters agree to be vote triplers (~30-60% via canvassing; ~20-50% via phone bank; ~3-6% via cold SMS), and it is possible these individuals differ from the overall public in systematic ways. Unfortunately, existing research does not allow us to predict with any reliability who will become a vote tripler and identify these individuals in our sample. While drop-off in the study could in principle be correlated with unwillingness to vote triple in real life, we have no real confidence this is the case.
In an imperfect attempt to improve generalizability, we asked subjects how likely they would be to say yes to vote tripling if they were asked to do it in real life. Table 2 shows the responses:
Table 2: Likelihood to vote triple in practice
Notably S2 subjects, who presumably took the study more seriously in general, indicated they were less likely to vote triple in real life. We suspect this is due to taking the question more seriously than their counterparts who provided questionable data in other ways as well. The fact that 65% of S2 friend-match triplers were extremely or moderately likely to triple is roughly consistent with what Vote Tripling sees in the field, in high-conversion contexts. The S1 sample does not seem to have provided meaningful answers to this question, overwhelmingly indicating they would be willing to vote triple when this is very unlikely to be the case.
Manual inspection reveals that subjects in the “extremely likely” and “moderately likely” categories do provide answers that systematically differ from those in other categories, in ways that can only partially be explained by other covariates — and that this is the appropriate location for a cut point along the five values of this variable. As such, we define a third sample, S3, of S2 voters who indicated they were “extremely likely” or “moderately likely” to triple. Where S2 and S3 results vary significantly, we present both.
2.3 Representativeness of sample
Table 3 compares our sample to a random sample of New York voters and a random sample of likely Democratic campaign targets. Note that this random sample includes inactive NY voters, many of whom have moved and no longer vote in New York, and thus has lower turnout rates than those published after elections. Inactive voters are included in the list that we loaded into Reach, so we include them here for consistency in understanding characteristics of triplers’ friends.
Table 3: Characteristics of triplers in study
14: Based on voter file, which, from inspection, is commensurate to the self-report. Targetsmart has Hispanic as a race rather than a separate field.
15: Partisanship score is used throughout this paper, and can be interpreted as the probability that a given voter casts her vote for a Democrat, conditional on her voting. If 100 voters with mean partisanship score=80 all cast ballots, there will be, on average, 80 votes for Democrats. If these are 100 net votes, we have generated 60 net Democratic votes.
16: This is lower than publicly reported statistics, because the voter file data we are working with includes inactive voters, who are not generally included in the denominator of turnout rates. The same caveat applies for midterm turnout.
17: Targetsmart breaks voters into six categories based on density of their census block. Urban voters are the top two densest categories, U5 and U6.
A few things are worth noting:
Relative to New York State Democrats, people of color are under-represented in this sample, especially the sample of those who provided reliable data.
The sample — especially the usable sample — skews somewhat young.
The sample is more Democratic than New York as a whole — which makes sense given that we rejected GOP voters — but less Democratic than the type of sample a campaign is liable to draw. This is partially an artifact, since screening on partisanship score will have a larger impact on that same score than screening on self-reported partisanship, with imperfect correlation to partisanship score. Regardless, given that this study relies heavily on the partisanship score, the fact remains we have an allegedly less left-leaning group than campaigns are liable to have.
Our sample is somewhat more likely to vote than the overall population. This is somewhat surprising. Perhaps less engaged populations dropped out of the study when the political nature of it became clear. This bodes well for generalizability, since more engaged voters tend to be triplers.
NYC voters are slightly under-represented. The vast difference between columns 1 and 2 is somewhat surprising, and we do not have a clear explanation for it. Relatedly, the sample is slightly less urban than the state overall.
The sample voted at a much higher rate in 2018 than their midterm propensity scores would imply. But this was true for all voters, as columns 4 and 5 make clear. There is no real reason to think that the midterm scores are especially inaccurate for this population.
3. Results: partisanship
3.1 Partisanship of triplers’ friends
Table 4: Headline partisanship among friends
18: Dropping those whose party registration is not recorded at all.
Across the board, triplers pick friends who skew to the left. Including all triplers in the sample (Row 1-2), friends skew about 10 percentage points more Democratic than a random sample of New Yorkers (Row 7). This remains true, with slightly more modest effects, outside of New York City; in NYC, identifying Dems is basically shooting fish in a barrel (Column 4). But the results are more encouraging when considering: (a) triplers whom campaigns are liable to mobilize (Row 5) select targets around 15pp more Democratic than random sample, and (b) the subset most likely to actually triple (Row 6) select targets slightly more Democratic still.
Another way to think about this data is to compare the partisan efficiency of triplers' targeting to the partisan efficiency of campaigns’ targeting. Campaigns generally target voters with partisan scores over 60, whose mean scores, in Row 8, are around 90, even when the prevailing mean is as low as 55 (Column 4). Viewed this way, triplers' targeting is somewhere around half as efficient as a campaign’s targeting.
Table 5: Net Democratic votes per net vote
3.2 Heterogeneity in friends’ partisanship by tripler
Unsurprisingly, as suggested by the above results, triplers that are more Democratic are more likely to pick Democratic friends. Table 6 shows that this correlation is not simply a binary relationship in which GOP triplers pick GOP friends and Democratic triplers pick Democratic friends; when restricting only to Democratic triplers, the correlation between tripler and friend partisanship remains, and is still significant (Column (2)). (The mathematical validity of these results is somewhat questionable given that the numerical properties of the Targetsmart partisanship score are not entirely clear; but, as a heuristic for campaigns these results suggest viable rules of thumb.)
Table 6: Correlation of tripler-friend partisanship (S2 sample only)
Columns (1) and (2) OLS, columns (3) and (4) logistic regression. S2 sample only. T statistics in parentheses. *=p<.1,**=p<.05,***=p<.01.
Figure 1 shows these results graphically, plotting triplers’ partisanship against the average of their friends’ partisanship, and makes clear the linearity assumption in Table 6 is not very tenable:
Figure 1: Partisan targeting by partisanship of tripler
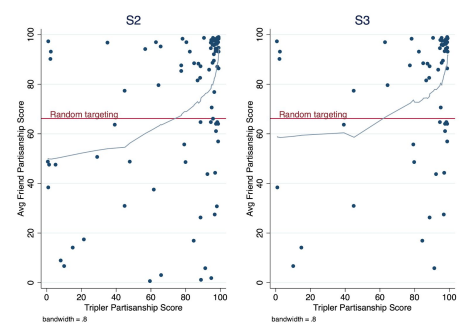
The graphs make very clear that triplers’ targeting improves drastically as they become more partisan — and also, encouragingly, the targeting of likely triplers is better than that of unlikely triplers, even after considering that likely triplers are more Democratic than unlikely triplers. While recruiting triplers with partisanship scores as low as 60 is still liable to be productive from a net votes perspective, the results make a strong case for focusing tripling efforts on the strongest partisans. As a rule of thumb, the evidence suggests campaigns would be best off focusing recruitment efforts on potential triplers with partisanship scores over 70.
What other tripler attributes are strong predictors of friends’ partisanship? Given the large number of highly correlated covariates describing triplers, we use the R package glmnet to implement penalized LASSO logistic regressions with cross-validated lambda on the S2 sample across a variety of specifications to determine the primary predictors of triplers’ friends’ partisanship.19 The specifications include: (1) including all triplers versus restricting only to reliable Democratic triplers, (2) including all triplers versus restricting only to white triplers (because of confounding effects across sociodemography), (3) predicting partisanship score vs binary partisanship. The model runs indicate the following trends, in decreasing order of importance:
Activism: One might suspect that more politically engaged voters, being more savvy politically, would pick more Democratic friends. This turns out to be true: More activist voters -- measured by self-report of number of offline political activities a voter engages20 in -- select significantly more Democratic friends. Depending on the specification, more activist voters select friends who are 5-25 points more Democratic than the least activist voters.
Likelihood to triple: Self-reported likelihood to triple (S3) is a stronger predictor of friends’ partisanship than most demographic characteristics. S3 also appears to have some effect over and above the measure of self-reported activism. If self-report is reliable, those who select into tripling have partisan targeting about 3-5pp better than other similar voters, which is a reassuring result.
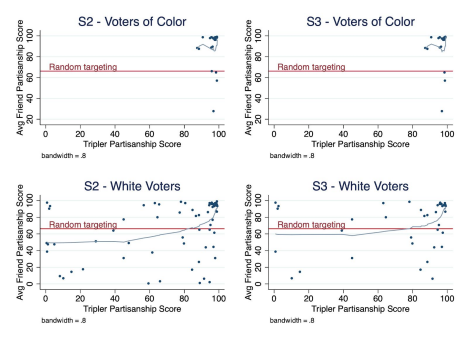
Race: Black and Hispanic voters reliably choose more Democratic friends, over and above the effect of their own partisanship score. This is presumably driven by Black and Hispanic voters selecting other Black and Hispanic voters (see section 6), who vote overwhelmingly Democratic.
Voting history: One might expect voting history to show the same pattern as activism, with more regular voters being more politically engaged and thus making more partisan savvy choices. This effect turns out not to hold true: More regular voters appear to, if anything, select slightly less partisan triplers. However, this effect is weak, and disappears in some specifications. It is possible the effect is driven by a correlation between regular voting and either race (white) or higher income, which is correlated with a more conservative political network.
Age: In some specifications, older voters pick more Democratic friends, but this effect is missing in most specifications and is likely not a strong predictor above partisan score and other demographics.
Gender: In some specifications, female voters pick more Democratic friends (presumably because they choose other female voters; see section 6), but this effect is missing in most specifications and is likely not a strong predictor above partisan score and other demographics.
The activism finding is not especially actionable, but the racial finding, in principle, is. Figure 2 shows that result visually — though given the high partisanship scores of triplers of color, it is a little hard to see:
19: When predicting continuous partisanship score, we cross-validate on mean absolute error rather than mean squared error in line with the seemingly non-linear nature of the partisanship score, as well as to help drive more coefficients to zero.
20: We asked subjects to indicate which of several online (e.g. posting about politics, signing petitions) and offline (e.g. attending rallies) political activities they regularly engage in, and counted the number of each. This index was used as a predictor. Online activities were not predictive of friend partisanship, but offline activities were.
Figure 2: Partisan targeting by partisanship and race of tripler
3.3 Triplers’ perceptions of their friends’ partisanship
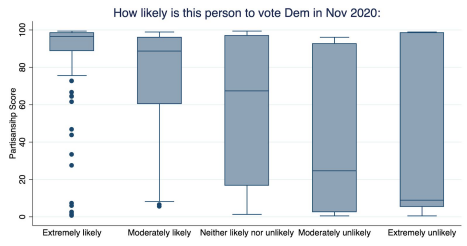
To what degree is triplers' imperfect targeting due to not attempting to target Democrats, versus attempting to but having imperfect information on their friends? We asked subjects to assess on a five-point scale, for each friend, how likely that friend was to support a Democrat for president in November. By comparing these assessments to the friends’ partisanship scores, we can assess to what degree triplers have accurate information about their friends’ partisanship. (Note for simplicity that we are assuming the voter file data is more likely to be correct than triplers’ perceptions, which may not in all cases be entirely correct; triplers may have more nuanced or up-to-date impressions of their friends’ partisanship than Targetsmart.)
First, we can see that there is a correlation between perceived and modeled partisanship, but it is far from perfect:
Figure 3: Perceived vs voter file modeled partisanship (S2; S1 shows similar results)
To make this more rigorous, we can define two types of errors in triplers’ perceptions:
Type A error is when a tripler assesses their friend’s partisanship to be ambiguous (“neither likely nor unlikely”) but the voter file data suggests it is not (partisanship>70 or <30).
Type B error is when a tripler assesses their friend’s partisanship to be left of center when it is actually clearly right of center (<40) or vice versa.
Table 7: Error rate by perception of partisanship (S1 shows similar results to S2)
Total gross GOP votes is the expected number of GOP votes that would result if the entire population in that row voted, based on partisanship scores.
Type A errors are relatively frequent, which is unsurprising given that most voters are (or are at least coded to be) reliable partisans. Type B errors account for less than half of all errors; among friends where triplers assessed clear partisanship, the error rate is only 12%.
Note that Type B errors are more common when the tripler assesses their friend to be GOP, but because so many more friends are assessed to be Dems, there are a larger number of errors in the other direction.
We repeated the LASSO analysis to assess which attributes of triplers and friends are most likely to produce errors. A few factors stand out:
Stronger partisan triplers are less likely to make errors, presumably because their entire networks are more partisan and it is harder to find a mismatch.
Over and above partisanship and other demographic traits, self-reported probable triplers are less likely to make errors.
Errors are more likely when the friend selected is white. This is presumably driven by the fact that white voters’ partisanship is less a foregone conclusion than racial minorities.
More politically engaged triplers are less likely to make errors, presumably because they are savvier politically.
Errors are very important to the targeting. 53% of friends with partisanship scores below 50 were included due to errors in S2, 59% in S3, and 61% in S1. Table 8 shows the results of Table 4, dropping friends whose perceived partisanship was incorrect.
Table 8: Net Democratic votes per net vote, without errors
Once we remove perception errors, triplers’ targeting starts to look fairly commensurate to campaigns’ targeting — especially among likely triplers. In other words, triplers intend to mobilize reliable partisans, and when they fail to do so, it is usually a product of perceptual error more than anything else.
3.4 Coaching for partisanship
All of the results to date are pooled across all phrasings. Is the picture different if we look at the four non-Democratic messages compared to the one specifically coaching Dems? That is, can we coach triplers to do better? Results should be interpreted with caution because of the small sample sizes, but the answer appears to be yes: using the “remind 3 Democratic friends to vote” phrasing, triplers select significantly more left-leaning friends. Notably, the randomization for this message was not balanced; subjects seeing the 3 Democratic friends messaging were significantly (p=.05) less Democratic than others. Given the high correlation of triplers and friends’ partisanship, the treatment effect of the messaging unsurprisingly gets much bigger if we control for tripler partisanship.
Table 9: Impact of coaching
DV is partisanship score of friends. OLS regressions, standard errors clustered at the level of the subject. T statistics in parentheses. *=p<.1, **=p<.05, ***=p<.001.
There are two important caveats to these results. First, the result is only suggestive for probable triplers and is indeed significantly smaller once other controls are included. It is likely that the gains are smaller for likely triplers, whose partisan targeting was already quite good. Second, especially among non-NYC triplers, by random chance, subjects shown message 2 were substantially more likely to be likely triplers. Controlling for likeliness shows that this is not what is driving the result, but it does make some of the resulting estimates hard to interpret.
The partisan efficiency using only the ‘Democratic friends’ treatment is considerably higher than without it; the efficiency gains in Table 10 are roughly commensurate to the gains from dropping errors, as shown in Table 8.
Table 10: Net Democratic votes per net vote, “Democratic friends” messaging
Given that the lower partisan efficiency of triplers was shown to be due significantly to errors, it is worth probing the mechanism behind this messaging: did “Democratic friends” get triplers to select farther-left friends with similar numbers of errors, or did they pick friends they were more sure about? It seems both factors were in play. Triplers with the partisan messaging picked friends they perceived to be more Democratic; but they also made fewer partisanship errors among the friends they selected.
Table 11: Errors given different messaging (S2 sample; S1 shows similar results)
An extremely speculative LASSO analysis of interaction effects between messaging and a variety of tripler characteristics suggests that the “Democratic friends” treatment is especially effective among older triplers, but given the tiny sample size involved, we consider this result highly speculative.
4. Results: voter propensity of friends
4.1 Voter propensity of triplers’ friends
Table 12: Headline voter propensity among friends
Last five elections in Column 3: general 2016-2019 and primary 2016.
Table 12 shows the voter propensity of the selected friends, using a variety of different measures. At first blush, selected friends appear to be meaningfully more likely to vote than a random sample, but this difference is likely an artifact: the voter file data we used contains some number of voters in an inactive status, many of whom are likely to have moved. Public reports, presumably using a smaller denominator without these voters, show New York’s 2016 turnout at 67%21— much closer to the 69% among triplers’ friends. Even then, the additional boost among triplers is likely to be an artifact, with even some active voters having moved recently, and triplers accordingly less likely to select them. Taking these considerations into account, it seems likely that triplers’ friends have roughly average voter propensity. Because the triplers in our sample are slightly above average voter propensity, triplers are selecting friends who are, on average, about 5pp less likely to vote than the triplers themselves are. S3triplers are less likely to vote than the overall sample and accordingly have lower-propensity triplers, but the relationship remains similar.
As with partisanship, homophily plays a large role: high-propensity triplers select high-propensity friends and the relationship is very significant (p<.05 for presidential turnout; p<.001 for midterm turnout). But in this case, the relationship is not quite as predictive as with partisanship. About a third of triplers’ friends have turnout scores within 10 points of the triplers’ scores (using midterm turnout scores); the rest can be quite far apart. Tripler propensity explains only 8% of midterm turnout score variation, and 2% of presidential turnout score variation. Put differently, triplers with a modeled <50% chance of voting in the midterm select friends whose mean predicted midterm turnout is 39% (38% for S3); triplers with a modeled >50% chance of voting in the midterm select friends whose mean predicted turnout is 55% (48% for S3). Put yet another way, over a third of triplers select friends whose 2018 voting record does not match their own — and the same pattern holds for 2016. For S3, the figure is 40%.
21: https://blog.timesunion.com/capitol/archives/273112/report-new-york-ranks-41st-in-voter-turnout-in-2016/
Figure 4: Voter propensity scores of triplers and their friends (S2 and S3)
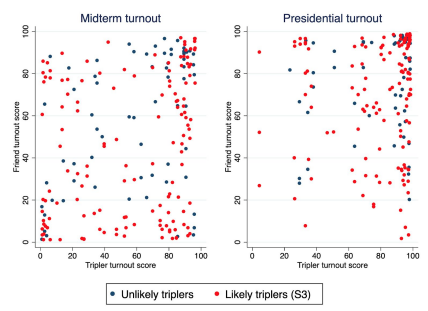
Table 13: Voting records of triplers and friends (S2)
An important implication is that high-propensity voters22 do sometimes select low-propensity voters. Even among triplers who voted in nearly every recent election, 13% of their selected friends did not vote in 2016, and 20% did not vote in 2018. Among S3triplers, these numbers are 15% and 24%, respectively. Prospective triplers often report “all my friends vote,” but this is not quite as true as they think.
On the other hand, high-activism voters — measured by the number of offline political activities undertaken by the tripler — select very few low-propensity friends. Among the highest-activism triplers in the sample, just 11% did not vote in 2018.
22: Voted in at least 4 out of 5 of: 2016-2019 generals, and 2016 primary.
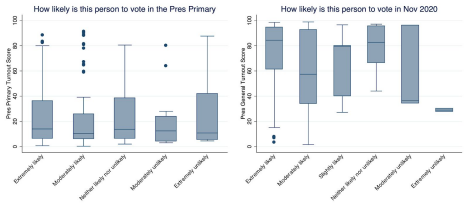
4.2 Triplers’ perceptions of friends’ voter propensity
Relatedly, unlike in the case of partisanship, triplers do not appear to know their friends’ propensity to vote. While perceptions are correlated with Targetsmart turnout scores, the correlation is not strong. To give a specific example, about a quarter of friends rated “extremely likely” to vote in November 2020 did not actually vote in November 2016.
Figure 5: Perceptions of friend’s propensity to vote (S2; S1 are substantively similar)
4.3 Coaching for propensity
Given triplers’ generally poor grasp of their friends’ propensity to vote, it is not surprising that the script encouraging triplers to target low-propensity voters (“3 friends who could use a nudge”) was almost entirely unsuccessful in producing a lower-propensity voter pool. Across five different metrics of voter propensity and four different model specifications, a couple of S1 models suggest the message produces friends 3-6pp less likely to vote at best, and even then the effect is not significant.
Notably, the same lack of a coaching effect appears even if we use perceived voter propensity as the outcome variable.
5. Results: voter registration status of friends
The results presented to date assume that non-finding of friends in Reach was essentially due to at-random user error, and that Reach-tagged friends are representative of all friends. Another possibility, of course, is that friends not tagged in Reach were not in Reach at all because they are not registered voters, or not registered voters in the state of New York. That is, perhaps vote triplers do not reliably select in-state, registered voters.
Note that we did ask subjects about this. For each name they provided, we asked if the person lived in New York State, and asked subjects to rate on a scale of 0-100 the probability the person was registered to vote in the United States. Both are predictive of not being found; friends reported not to live in NY are 54 percentage points less likely to be found, and there is a fairly linear relationship between the U.S. registration question and found rates:
Figure 6: Correlation between perceptions of U.S. registration and found rate (S2)
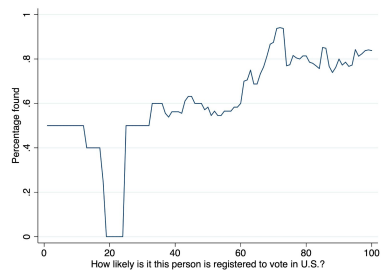
Moving average with window inversely proportional to density.
(Note that most values below 30 in this graph are likely noise, given small sample size, and a data artifact that defaulted some values to 0.)
Table 14 explores the match rates. To begin with, we keep only S2, who were evidently more willing to reliably tag in Reach at all. Further, we keep only triplers who found at least one friend: essentially, we assume that anyone using Reach in good faith would have successfully found at least one friend, and anyone else was not using it properly. This assumption probably incorrectly drops a few triplers who truly found no one and thus inflates match rates here slightly.
Table 14: Friends found and not found (S2, with at least one friend found)
Put a different way, out of 291 named friends, 218 were found (74.9%), 33 (11.3%) were not found but indeed should not have been found based on triplers’ own information, and 40 (13.7%) were not found despite the tripler expecting they should have been. Anecdotally, users not infrequently have difficulty finding voters in Reach, even when they have perfect address2 and name spelling information on the voter. Given that subjects may have had imperfect information in searching for their friends, it seems plausible that half of the 40 were due to user error in this regard. This leaves a breakdown as shown in Figure 7:
Figure 7: Found rates (S2)
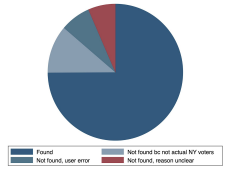
With the caveat again that dropping subjects with no matches inflates the numbers, we find that the vast majority of triplers’ friends — probably about 80% — are registered voters in the same state. (Note that the prompt had to do with a campaign for congress, so we should expect, in theory, all friends would be within the state.) While on one hand it is somewhat surprising the number is not higher, it does provide reassurance that the vast majority of triplers’ friends are valid targets.
The rate of triplers found varies by a number of tripler characteristics, which are highly correlated, and it is hard to tell which characteristic has predictive power. Penalized logistic regression yields a univariate model using only the activism rate (as measured by offline political activities); higher activism voters are significantly more likely to find friends in Reach (p=.03), but this effect is relatively weak in substantive terms.
The evidence on whether the different messages yield different rates of matches is ambiguous. There is slight evidence that: (1) the “Democrats” messaging yields fewer friends who live in New York State and fewer matches overall, and (2) the “neighbors” messaging yields more friends who live in New York State, though no more matches overall, which also suggests, (3) inexplicable mismatches (the red category in the pie chart) are higher in the “neighbors” messaging — perhaps because “neighbors” encourages triplers to select neighbors whose personal information they do not know well enough to find in the voter file. (If this is true, it is possible the neighbors/housemates phrasing works better than reported in the next section.) However, all of these effects are relatively small and given the small sample size should be interpreted with caution.
23: As a test to confirm that users had correctly configured Reach, we asked them to identify a prominent New York politician in the dataset and copy-paste their Reach ID. We provided a correct spelling of the politician and the town in which he or she lived, and provided clear instructions to find the politician in the database. However, a substantial number of subjects not only failed to find the politician at first, but were so convinced the politician was not present that they added a voter to the Reach database of the same name. (This happened repeatedly, and we had to continually change the politician we asked users to identify, since duplicates were then present in Reach.) This anecdote suggests that users not infrequently fail to find voters who are indeed there due to carelessness.
6. Results: geography of friends
6.1 Headline results on geography of friends
Table 15 considers how frequently triplers pick geographically proximate friends, for the S2 sample. (There are no significant differences between the S2 and S3 samples.) Recall that the tripling prompt referenced a congressional campaign, which should, in theory, have restricted friends to the same congressional district as the tripler. This analysis returns to the assumption that unmatched friends were unmatched due to human error, even though, as outlined in the previous section, it is likely some of the friends were indeed out of state — meaning that the estimates in Columns (1-3) are likely too optimistic by about 25%. Columns (4-6), which look at the portion of triplers who offer at least one friend within the geography, are not subject to this issue, and thus provide relatively robust estimates of what portion of triplers will provide at least some GOTV effect within a given geography. Note we also examined if friends ever lived in a different address in the same building; this did not occur.
Table 15: Geography of friends (S2)
24: Based on the “city” field of address, which can be unreliable, or not fully indicative of a person’s location. In the borough of Queens, for example, each neighborhood is listed as a separate city for address purposes, and so in this data a voter in Ridgewood will be coded as in a different neighborhood than one in Maspeth.
A few notes are in order:
13% of triplers’ friends being coresidents matches well to VoteTripling.org’s previous field experiments, in which 11-13% of first names provided by triplers match to coresidents.
The picture is mixed for Congressional campaigns intending to use vote tripling. In dense urban areas, only a relatively small fraction of the tripling effect stays in the district, which is consistent with the relatively small and oddly-shaped districts in New York City25. In non-urban areas, most of the effect stays in the district, but it is closer to 50% than 100%. A significant majority of triplers will have at least some effect in the district, but the targeting is not great.
For state legislative campaigns, the outlook is slightly worse still (although keep in mind that the test provided a prompt around a congressional campaign, and it is possible that a State House or State Senate prompt would have yielded more geographically proximate targets). In urban areas, likely only a small minority of the effect is felt in the district. In less urban areas, more of the effect remains, but perhaps not much more than half.
25: Note that we ran this analysis both using the distinction of NYC-vs-non-NYC and the distinction of whether Targetsmart coded the tripler as living in a highly urban census block (urbanicity==”U5”,”U6”). The results were nearly identical.
6.2 Coaching more proximate geography
One of the messaging variants — “will you remind 3 neighbors or housemates to vote” — was hypothesized to increase the geographic proximity of triplers’ selections. (Recall, from Section 2, that errors in the survey coding likely watered down the effect of this wording by returning to the “friends” phrasing after the initial message.) Across a wide variety of specifications, it did not work: using all of the 12 different outcomes from Table 15 above, running regressions with and without controls, this message if anything decreases the geographic proximity of selections. A few basic specifications are shown in Table 16, Columns (1-2) and (5-6). The effects are generally not significant, especially with controls, so it seems likely that the effect is zero rather than negative. Still, the hypothesized positive effect is not there.
One partial explanation could be the issue raised in Section 5 about finding neighbors in the voter file. Still, this finding is somewhat surprising; one would expect that instructing a tripler to remind their “neighbors and housemates” would, if nothing else, significantly increase the number of housemates she chose. One explanation for this paradox might be that people do not consider the family they live with to be “housemates,” and so find themselves at a loss when presented with this message. If this were true, it might be the case that younger voters, who are more likely to have “housemates,” would react better to this coaching. Columns (3) and (4) suggest this is the case: the “neighbors/housemates” message does significantly increase the portion of triplers' friends at the same address, but only for young voters. The effect turns around for voters over around 30-35 years of age. Note the same heterogeneity is not present for same-district results.
Table 16: Coaching geography (S2)
If “housemates” was too impersonal language to get older votes to select the family they live with, perhaps triplers would choose people in their households if we coach them to select family members. With the caveat again that the survey coding may have watered down the impact, Table 17 shows that this also appears not to be the case — although the age interaction, surprisingly, remains significant.
Table 17: Coaching geography, “family members” (S2)
7. Results: other characteristics of friends
7.1 Relative demographics
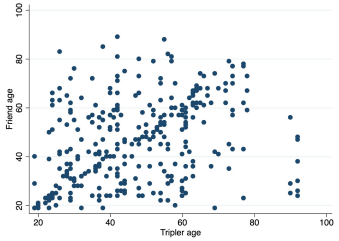
Triplers and their friends generally share demographic characteristics. While unsurprising, the magnitude of this effect is perhaps rather startlingly high, as shown in Table 18.
Table 18: Relative demographics of friends (S2)
Note that these effects are not driven entirely by a single group within each category. Male triplers pick male friends 65% of the time; female triplers pick female friends 69% of the time.
Race effects are disproportionately driven by white triplers, who pick white friends 90% of the time, but black triplers pick black friends 55% of the time, and Hispanic triplers pick Hispanic friends 93% of the time.
The age results are visually striking:
Figure 8: Relative ages of triplers and their friends
7.2 Types of relationships
Table 19 shows the relationship type categories for the people triplers select, based on self-report; Table 20 shows this in more detail. The headline takeaway is that the overwhelming majority of triplers select friends rather than family — or at least report them that way for simplicity. Note that this analysis includes all selected people rather than only those matched to the voter file, since the relationship was based on self-report. As such, it includes a broader population of triplers, including those who tagged no voters in Reach.
Table 19: Relationships of triplers to the voters they select
Table 20: Relationships of triplers to the voters they select — detail
What is also striking is how little triplers seem to respond to coaching in this regard. Two of the treatments specifically nudged triplers towards people with whom they had specific, other, types of relationships — but this coaching was generally unsuccessful. Neither the “family” nor the “neighbor/housemate” subtreatments succeeded in changing the portion of selections who were family members or neighbors/housemates (though, again, recall that the treatments were unintentionally watered down). Restricting the analysis only to those triplers with an age match and who tag at least one person in Reach (as used for most of the paper) does boost the “family” number to 25% in the “family” messaging (full analysis not shown) — but even this is a surprisingly small number.
The relationship data is from self-report and could perhaps be coded sloppily by subjects, but the voter file provides corroborating evidence. Table 21 shows portions of selections whose last names match the triplers’ last names, which is of course a proxy for family members, if a weak one. The data does show a boost in last name matches among the “family” treatment, but not of the size one might expect if the messaging really did push triplers to select many more family members.
Table 21: Last name matches between triplers and the voters they select
8. Results: additional friends
Future relational work may be interested in the question of what happens if “triplers” select more than three friends. While we have no clear way to answer this question, we can examine if there are any trends across the three friends; are friends, for example, decreasingly Democratic, increasingly likely to vote, or any other such trend. We regress a variety of attributes on the index of the friend and generally do not see meaningful patterns across the three friends. Two slight trends are worth noting:
The first friend is significantly more likely to be in the same household than the other two. Relevantly, when triplers list their spouse, they almost always list spouse first, which is enough to account for this trend.
In the “Democratic friends” treatment only, the three friends are increasingly partisan, with the third friend 20 points more Democratic than the first. This trend is significant at p<.05. Perhaps triplers first select someone close to them, and as they search for further names, the instructions become more salient. Or, of course, given the vast number of hypotheses being tested here, this could simply be noise.
